Graphing Linear Equations on a Coordinate Plan
Slope- Intercept Form:
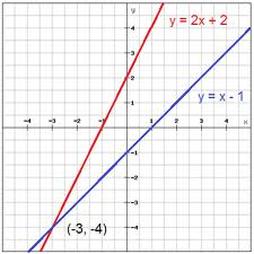
This is an example of Slope-Intercept Form Y = M X + B. M is the variable that represents the slope of a line, and B represents the Y-Intercept. In this example, the red lines equation is Y = 2X + 2. Since the single 2 is the Y-Intercept, your line should start at that point, on the vertical line called the Y-axis. 2X is the slope, so from the Y-Intercept, you should 'rise' 2 and 'run' 1. The blue lines equation is Y = X - 1. Like the red line, you'd start at the B, which is -1. And sense there is a hidden 1 in front of the X, the slope is rise 1 run 1. If you were to extend these lines further, you would find the point of intersection, which as you can see is at (-3,-4).
Standard Form / X & Y Intercepts:
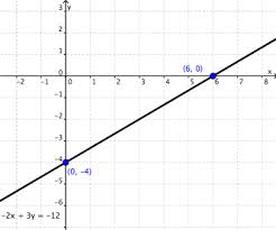
Standard form is more of a process than slope-intercept form. Instead of the Y being isolated, you have to get it alone using order of operations. In this example, -2X + 3Y = -12. First you would add the 2X, so you'd get 3Y = 2X -12. Then you'd divide the 3, which gives you Y = 2/3X - 4. Another way to graph standard form is to find the X and Y intercepts. You could make the Y = 0 to find X, which gives you 6. Then make the X = 0 to find the Y, and you'd get Y = -4. Now that you have the X and Y intercepts, connect the two dots to complete the line.
